
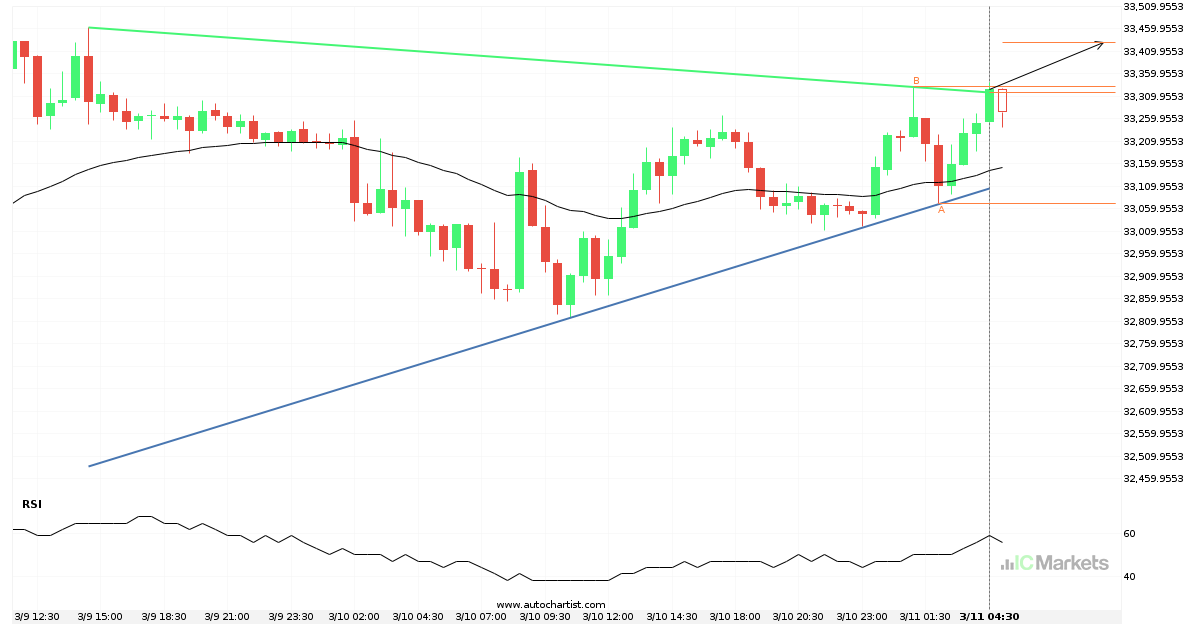
US Wall Street 30 Index has broken through resistance
US Wall Street 30 Index has broken through a resistance line. It has touched this line at least twice in the last 2 days. This breakout may indicate a potential move to 33429.8540 within the next 11 hours. Because we have seen it retrace from this position in the past, one should wait for confirmation […]
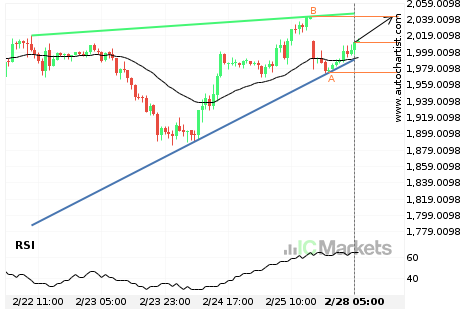
US SPX 500 Index approaching support of a Channel Down
US SPX 500 Index is approaching the support line of a Channel Down. It has touched this line numerous times in the last 9 days. If it tests this line again, it should do so in the next 2 days.
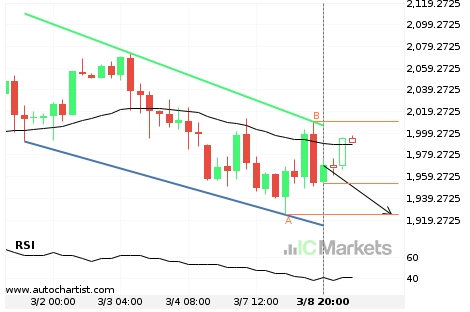
Either a rebound or a breakout imminent on US Small Cap 2000 Index
US Small Cap 2000 Index is heading towards the support line of a Channel Down. If this movement continues, the price of US Small Cap 2000 Index could test 1924.3300 within the next 2 days. It has tested this line numerous times in the past, so this movement could be short-lived and end up rebounding […]
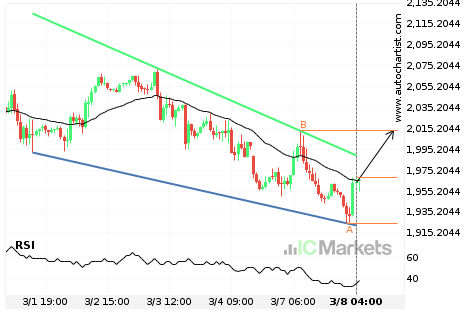
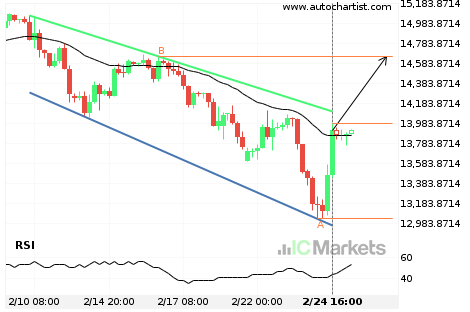
US Small Cap 2000 Index – getting close to resistance of a Falling Wedge
US Small Cap 2000 Index is moving towards a resistance line. Because we have seen it retrace from this line before, we could see either a break through this line, or a rebound back to current levels. It has touched this line numerous times in the last 7 days and may test it again within […]
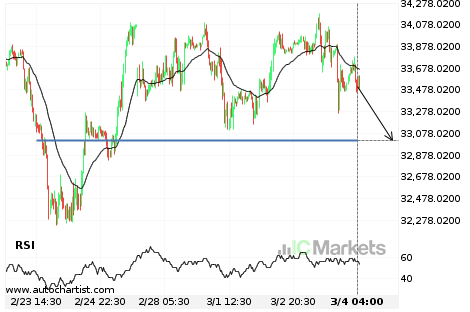
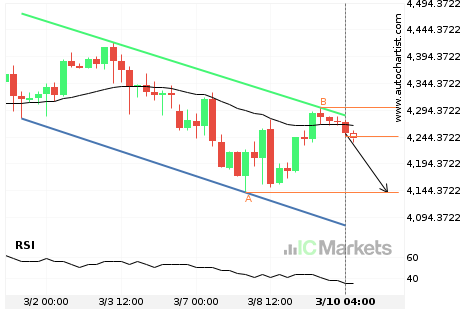
A final push possible on US Wall Street 30 Index
US Wall Street 30 Index is heading towards 33016.3984 and could reach this point within the next 2 days. It has tested this line numerous times in the past, and this time could be no different, ending in a rebound instead of a breakout. If the breakout doesn’t happen, we could see a retracement back […]

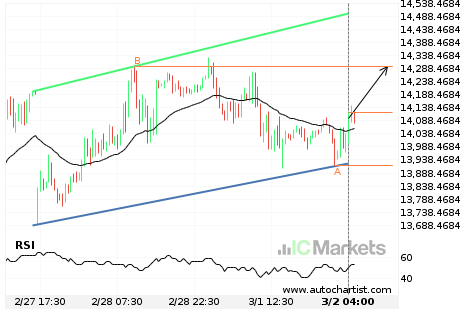
Either a rebound or a breakout imminent on US Tech 100 Index
US Tech 100 Index is heading towards the resistance line of a Rising Wedge. If this movement continues, the price of US Tech 100 Index could test 14331.9000 within the next 2 days. It has tested this line numerous times in the past, so this movement could be short-lived and end up rebounding just like […]
Either a rebound or a breakout imminent on US Tech 100 Index
US Tech 100 Index is heading towards the resistance line of a Channel Up. If this movement continues, the price of US Tech 100 Index could test 14297.3000 within the next 18 hours. It has tested this line numerous times in the past, so this movement could be short-lived and end up rebounding just like […]
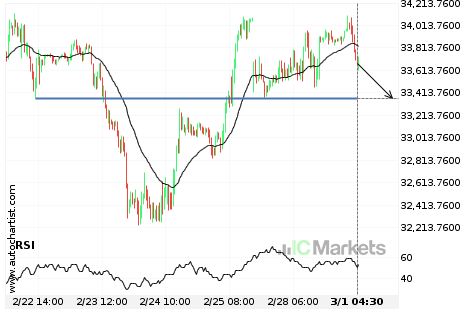
A final push possible on US Wall Street 30 Index
US Wall Street 30 Index is heading towards 33360.8984 and could reach this point within the next 2 days. It has tested this line numerous times in the past, and this time could be no different, ending in a rebound instead of a breakout. If the breakout doesn’t happen, we could see a retracement back […]
US Small Cap 2000 Index – getting close to resistance of a Rising Wedge
US Small Cap 2000 Index is moving towards a resistance line. Because we have seen it retrace from this line before, we could see either a break through this line, or a rebound back to current levels. It has touched this line numerous times in the last 6 days and may test it again within […]
US Tech 100 Index approaching resistance of a Channel Down
US Tech 100 Index is approaching the resistance line of a Channel Down. It has touched this line numerous times in the last 15 days. If it tests this line again, it should do so in the next 3 days.